Understanding battery performance is crucial for optimizing usage and extending lifespan. Two important concepts in this context are C-rate and battery discharge curves. This guide explains what C-rate means and how to interpret battery discharge curves effectively.
What Is C-rate?
The C-rate is a measure of the charge or discharge current of a battery relative to its capacity. It indicates how quickly a battery can be charged or discharged.
- Definition: A C-rate of 1C means that the battery will be fully charged or discharged in one hour. For example, a 2000mAh battery at 1C would be charged or discharged at 2000mA (2A).
- Higher C-rates: If you discharge a battery at 2C, it will be fully discharged in half an hour (4000mA for a 2000mAh battery). Conversely, charging at 0.5C would take two hours.
- Impact on Capacity: Charging or discharging at higher C-rates can reduce the effective capacity of the battery and potentially damage it if the rate exceeds the manufacturer‘s specifications.
How to Read Battery Discharge Curves
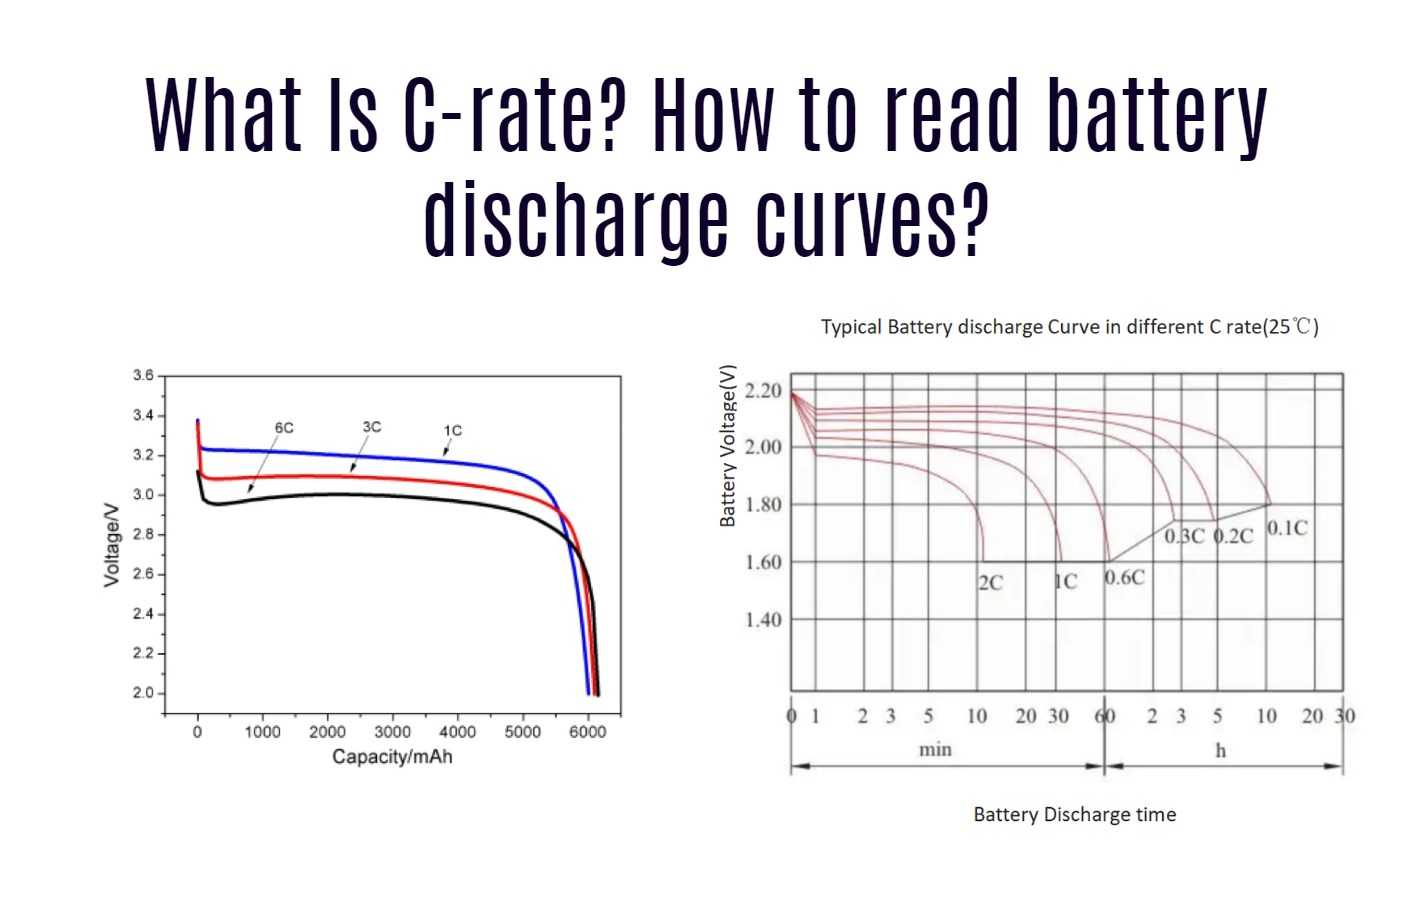
Battery discharge curves provide valuable insights into how a battery performs under different conditions. These curves plot voltage against time, capacity, or state of charge (SoC).
Wholesale lithium golf cart batteries with 10-year life? Check here.
Key Components of Discharge Curves
- Voltage Plateau:
- Initially, the voltage remains relatively stable during the early stages of discharge. This plateau indicates that the battery can deliver consistent power.
- Gradual Decline:
- After the plateau, the voltage begins to decline gradually. The slope of this decline can indicate the battery’s health and efficiency.
- End-of-Discharge Voltage:
- As the battery approaches depletion, voltage drops rapidly. This point is critical as discharging below this level can damage the battery.
Interpreting Discharge Curves
- Flat vs. Sloping Curves:
- A flat discharge curve indicates stable performance over time, making it easier to estimate remaining capacity based on voltage.
- A steeply sloping curve suggests that voltage drops quickly, complicating capacity estimation.
- Capacity Loss with Higher C-rates:
- Discharge curves reveal that as discharge rates increase (e.g., from 1C to 2C), the effective capacity often decreases due to increased internal resistance and heat generation.
Example Analysis
When analyzing a discharge curve:
- Look for the initial flat region; this indicates stable output.
- Observe how quickly the voltage drops after the plateau; a rapid drop signifies nearing depletion.
- Compare curves from different batteries; variations can indicate differences in chemistry, design, or age.
Latest Trends in Battery Technology
- Smart Battery Management Systems (BMS): New technologies are being developed that allow real-time monitoring of discharge curves and C-rate effects, enabling better management of battery health.
- Sustainability Initiatives: Manufacturers are focusing on eco-friendly production methods and longer-lasting batteries to reduce waste.
- Advanced Materials: Research is ongoing into new materials that enhance performance and safety, leading to improved discharge characteristics.
Redway Expert Comment
“As experts in lithium LiFePO4 technology, we emphasize that understanding C-rate and discharge curves is essential for optimizing battery performance. Properly interpreting these metrics allows users to make informed decisions about charging practices and application suitability.”
Want OEM lithium forklift batteries at wholesale prices? Check here.
Conclusion
In summary, understanding C-rate and how to read battery discharge curves is vital for anyone working with batteries. By grasping these concepts, you can improve your ability to manage battery performance effectively and extend their lifespan through informed usage practices.


